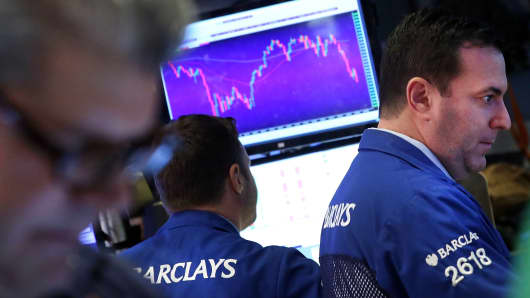
The stock market correction has been tough enough on Wall Street pros, but it’s exacted an even worse toll on retail investors.
One gauge measuring the performance of retail investor portfolios shows a decline of 8.15 percent in 2016, an even bigger drop than the 6.9 percent decline the S&P 500 showed prior to the start of Friday trading.
Results from Openfolio, a social network where investors share their ideas and platform construction, show its clients are underperforming the broader market. The results, culled from looking at a weighted average of 60,000 or so portfolios, reflect the difficulties facing the market this year.
Read MoreHas the selling finally stopped? 10 ways to tell
“Younger investors are doing even worse,” said Maxwell Lane, a researcher at Openfolio. “The largest sector in our index is technology. Everyone’s been taking gains in tech through this sell-off. That’s really been driving our index down.”
Indeed, technology is clustered at the bottom with materials, financials and energy as the worst performing of the 10 S&P 500 sectors in 2016, with each losing in the 12 percent range.
In the Openfolio universe, technology represents a 20.3 percent concentration in portfolios, with the next biggest (13.2 percent) in growth or value exchange-traded funds and 7.7 percent in financials.
Demographically, losses get worse the younger the age group. For those under 25, the decline is 8.9 percent; the 65-and-older cohort actually is outperforming, a bit, with a 6.64 percent drop.
Read More‘Great shakeout’ leading to big gains: Piper
Looking at broader measures of market preference and performance, the Openfoilo numbers make some sense.
The most over-owned names among fund managers are found in the tech sector, which holds the top three spots — Apple, Microsoft andAlphabet — as well as seven of the top 25, according to Credit Suisse. By market capitalization, tech comprises about 20.5 percent of the cap-weighted S&P 500 index, but has just 14 percent of the total number of stocks.
Historically speaking, heavily owned stocks virtually always underperform the market.
The best group when measuring levels of ownership are what Credit Suisse calls “falling stars,” or those where ownership falls the most. The top names in this category for the third quarter of 2015 were Cameron International, Qualcomm, Devon Energy, Kohl’s and Precision Castparts.
[“source -cncb”]


